4 Weird Tricks To Become A 10x Flexbox Engineer

Do you ever find yourself trying stuff out until they work? Did you make css-tricks’ guide to flexbox your default new-tab page (or even better, purchase the poster)?
If so, these tricks are for you!
Maybe you’re not going to become a 10x engineer like I promised. I do promise, however, that you’ll get more confident when authoring and debugging flexbox layouts in DevTools.
Authoring vs. Debugging
I believe DevTools sits in a unique position between our authoring and debugging workflows.
Traditionally, we write our code in text editors and then debug problems in DevTools. But with CSS more than with anything else, the line between these 2 steps in our dev cycle is a little blurry.
Sometimes we find ourselves writing lot’s of CSS code in DevTools and only then copying it back into our editors.
When it comes to JavaScript, or network calls, or even HTML structure, most of what we do in DevTools is debugging. But with CSS things are different.
The reason for this is when we edit CSS in the browser, something magical happens: debugging information appears right when we need them! Colors and sizes change in real time and computed values can be accessed as we type new properties.
This is something text editors have trouble doing. They act at the source file level, as they should. They don’t (and often can’t) know where the particular piece of code we’re writing will end up running.
But in DevTools, the piece of code we write is running at the same time. No compilation and download needed, we can re-write an entire piece of code, with logic and variables and see it take effect live.
So, even if DevTools will likely never become a full blown text editor, that supports saving, running extensions, with keyboard shortcuts and everything, it does something that no text editor can thanks to its ability to provide runtime debugging information.
That’s why tooling for the more complicated scenarios involving CSS is very interesting, it feels like Bret Victor’s "Inventing on Principles" where you write code, run it and debug it all at the same time and there’s no mode you have to be into to do these things.
With that in mind, let’s look at the usual problems people tend to have with flexbox: it’s hard to remember what properties do and we often have to try them all until the desired effect is reached.
Now, DevTools has access to the runtime environment, it knows which element we are working with, and the type of flexbox layout we’ve defined, as well as other things like text direction. Because of this it knows what the various flex properties will do when we use them. That means we can build tools that guide you while writing CSS, thanks to the runtime information available, with the goal to eliminate the trial and error process usually involved.
So, at the end of 2020, after we had shipped new css grid tooling in chromium, we formed again our small crew of designers, PMs and engineers, across Google and Microsoft, and set out to create a first series of tools for flexbox.
These features are now available in Edge 89 (which is, at the time of writing, available on the Dev channel), and in Chrome 89.
Turning on the features
For now, the features are still hidden by default since this is the first version and we wanted to slowly roll them out. They’ll soon be enabled by default, and when they are, we’ll be listening to feedback to address issues and work on an even better v2.
So, first things first:
- Open DevTools
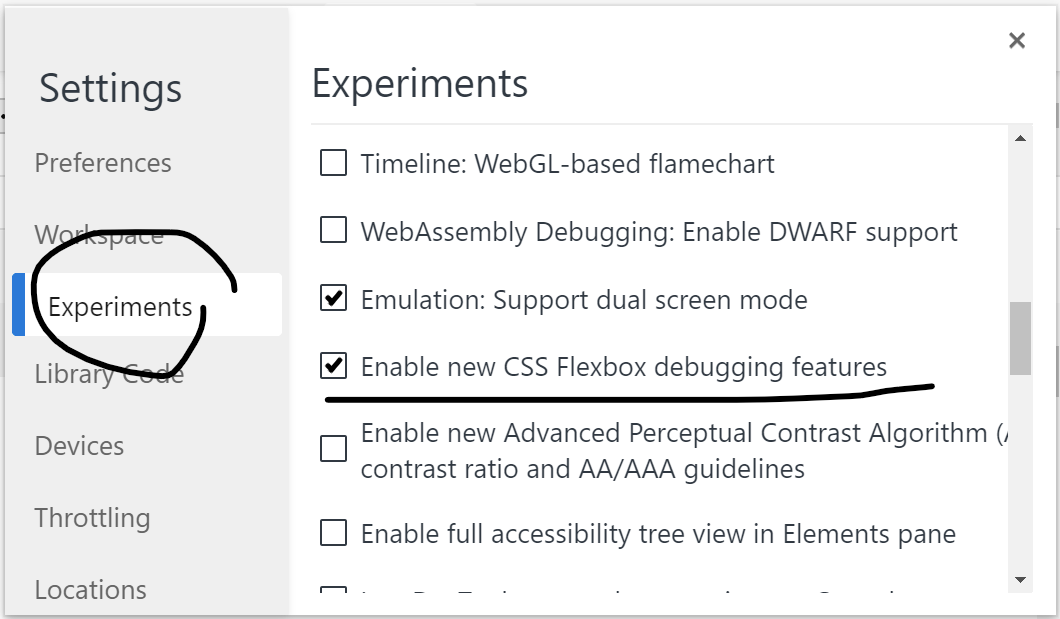
- Click the cog icon to open the settings
- Click on the Experiments tab
- Check the "Enable new CSS Flexbox debugging features" box
- Reload DevTools (there should be a button at the top letting you do that, but you could also just press F12 twice)
Trick 1 - Overlay
This might be the first one you see after you’ve enabled the feature. The easiest way to experience it is by clicking on the "Select Element" button in the toolbar and then moving your mouse over the page.
As soon as the element below the mouse is a flexbox container, the usual blue/green/purple highlight that appears on most elements will look a bit different.
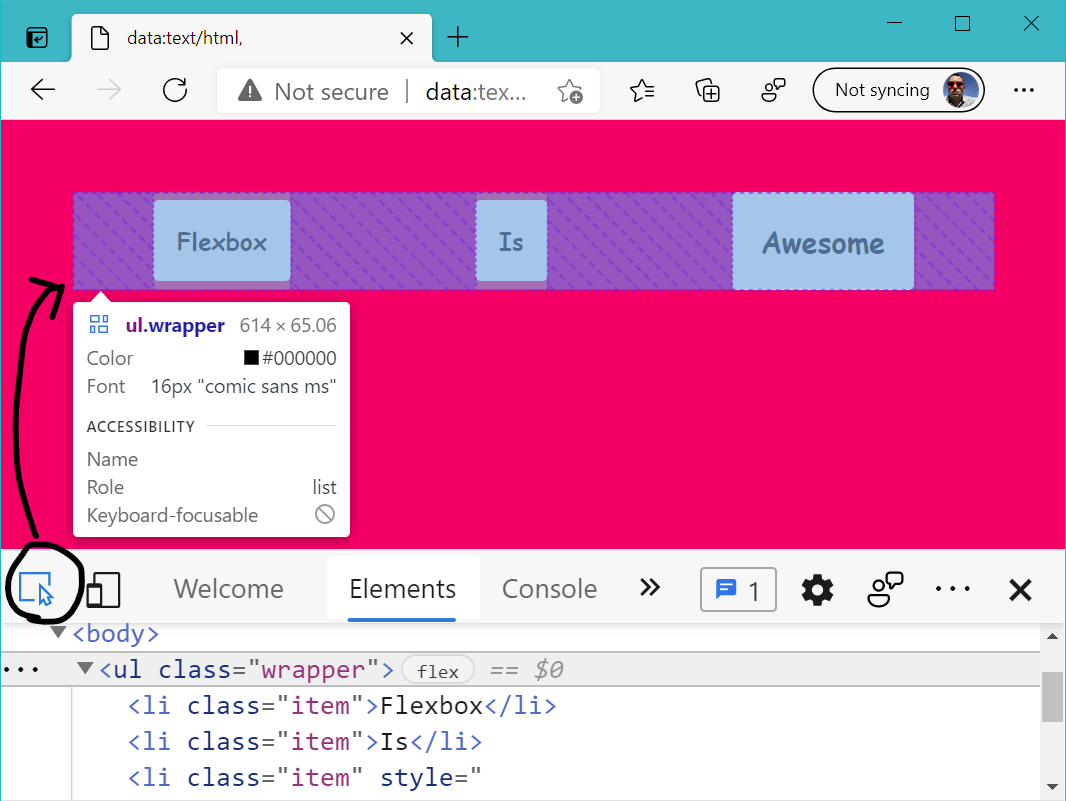
We call this thing the overlay, and for flexbox containers, it shows a few more things than for other elements:
- it draws a dashed border around the flexbox container itself,
- it draws a border around each flex line (if there is wrapping with
flex-wrap:wrap) and around each flex item, so it’s easy to see what’s an item and what isn’t (indeed, there are cases where it’s not obvious when e.g. absolute positioning is involved, or text nodes are present), - it displays a hatching pattern in the empty space caused by the various alignment properties you use.
You will also see the overlay as you move your mouse over elements inside the Elements panel.
It’s convenient because it’s right there when you need it and already gives you quite a number of interesting layout visual debugging information.
Trick 2 - Alignment icons
You can experience this new feature when editing CSS in the Styles pane of DevTools.
After you’ve put together a layout in your text editor and realize there’s a bug when you test it in the browser, that’s usually when you start messing around with the various properties available to you.
At this point, trial and error is usually required until you figure out the right property and value that you need.
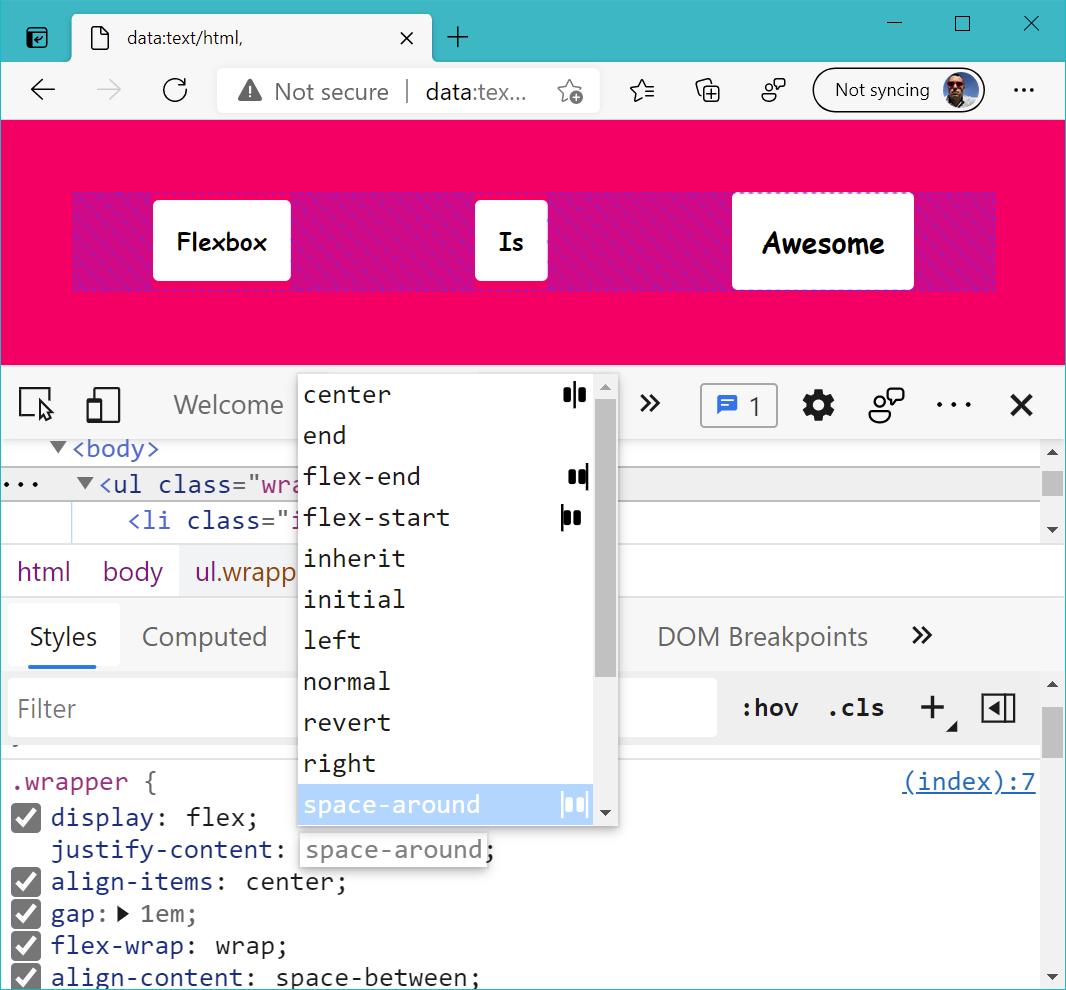
With this new feature, you will get a little help right there. As you start typing property names in the Styles panel, you will notice icons in the autocomplete popup to tell you exactly what to expect from the various values.
These icons are very convenient because they make it immediately obvious which direction a CSS property apply in.
This works with a number of properties like align-items, justify-content, align-content, align-self or flex-direction.
It’s also worth noting that these icons will always be correct even if your layout is in column direction rather than row, and even if you were to use a vertical writing-mode.
Trick 3 - CSS properties highlight
Another feature we added that goes hand in hand with the previous one is the ability to highlight parts of the page that result of certain flexbox CSS properties.
The situation is the following one: you’re looking at a website and notice a problem with the layout. You open DevTools on the element that has the problem and a number of CSS rules and properties are displayed, but you’re not sure which one is responsible for the problem.
Instead of changing the value of these properties at random, you can now just move your mouse over the properties and you will see parts of the page starting to light up.
For example, as seen above, if you hover over the justify-content property, the areas around and in between flex items (along the main axis of the flexbox container) will get highlighted in the page. It makes it easy to see the way space is distributed between items, and exactly what justify-content influences.
Hovering over align-items draws a line with an arrow pointing in the direction where the flex items are aligned along the cross axis.
So when you can’t remember what direction align-items works in, just hover over it and you’ll see.
What’s nice about this too is it works regardless of the direction of your flex layout or your text direction.
This works with other properties too, like align-content or gap as demonstrated below:
Trick 4 - Badges and Layout panel
My final trick for you today is something that already exists for CSS Grid and now also works for Flexbox.
It is the ability to quickly find elements in the page that define flebox layouts.
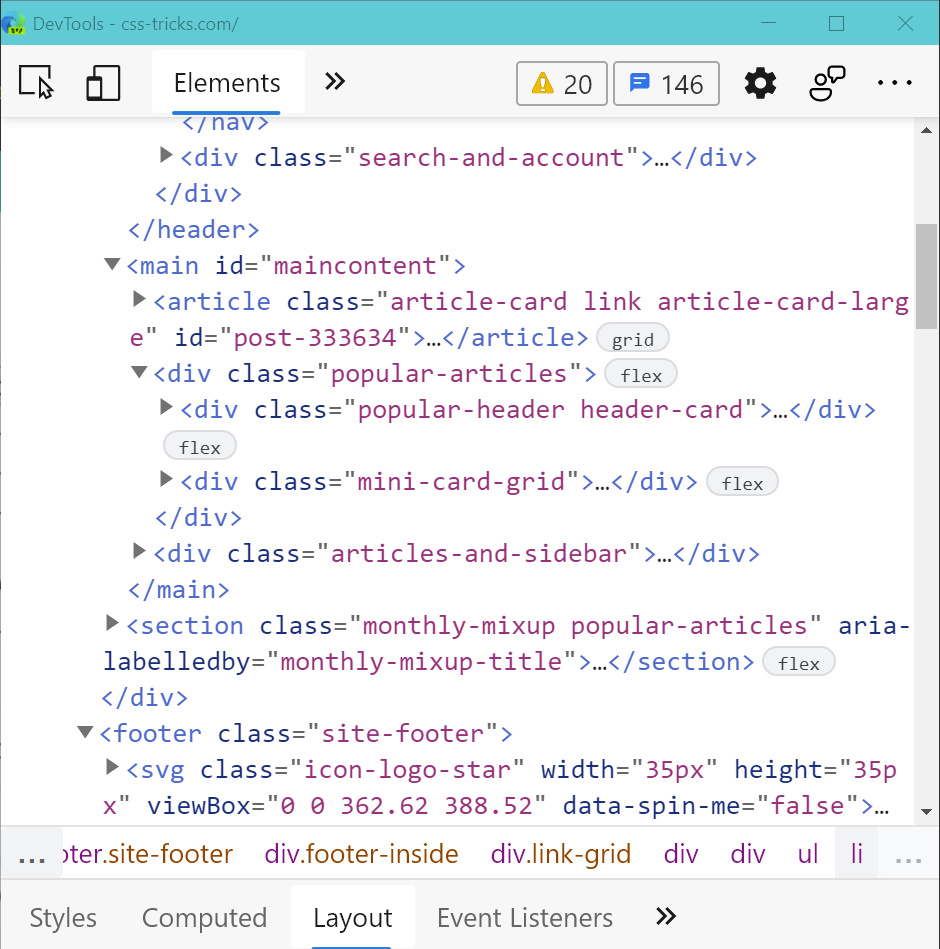
As pictured above, the Elements panel in DevTools now displays little flex badges next to elements that are flexbox containers. I find it very useful when navigating the DOM tree, it avoids having to click on each node and looking through the Styles pane looking for a display:flex declaration.
If you’re looking for a specific element but don’t know or remember where it is in the DOM, instead of expanding the tree, it might be quicker to head over to the (recently added) Layout panel.
This panel gives you the entire list of all flex and grid layouts in the page, in one place:
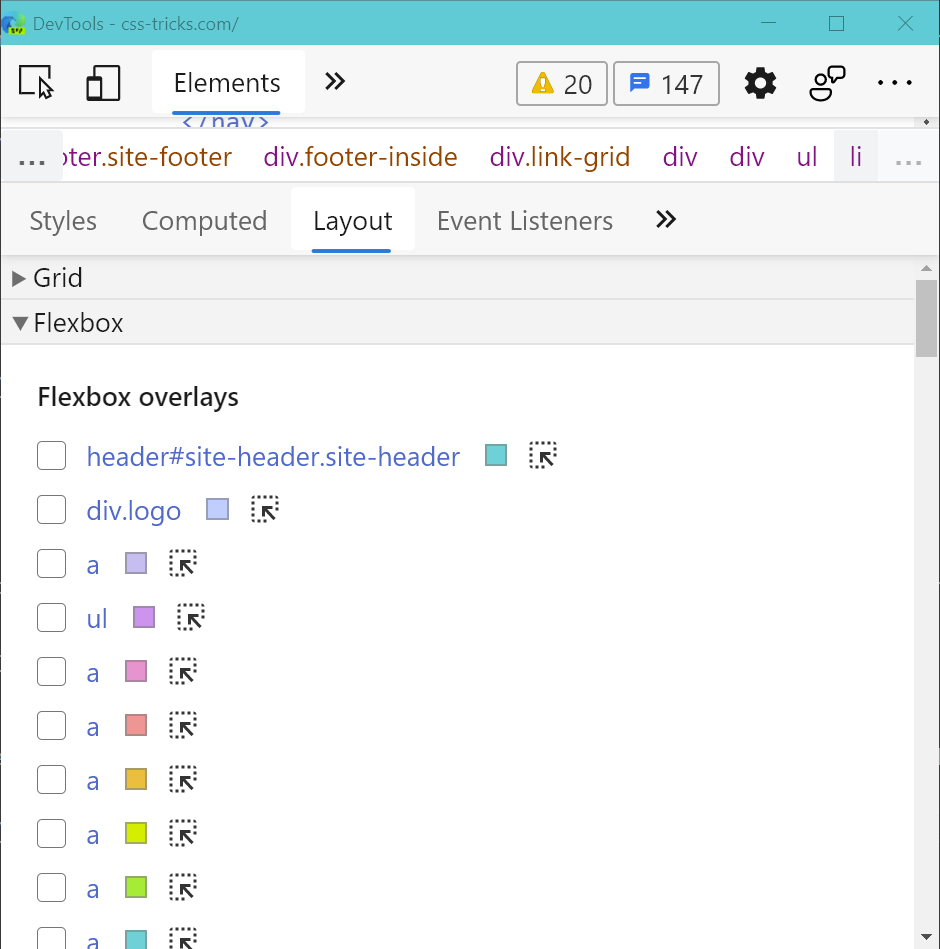
In addition, both the badges and Layout panel give you a way to toggle a persistent overlay. It’s basically a version of the overlay you see on hover when selecting element that persists on the page while you do other things.
You can show overlays for as many flexbox layouts as you want.
It makes it easy to debug the position or alignment of flexbox layouts while being able to see the boundaries of your containers and items as you mess with CSS properties.
That’s it for now! I hope you enjoy those new features, and please do let me know on Twitter if you have feedback about them.
There’s more to come in this area too, so stay tuned for even more helpful features.